Stop Guessing Which Menu Version Sells More
Test two descriptions, two photos, or two prices side by side. See which one gets more orders. Pick the winner. Done.
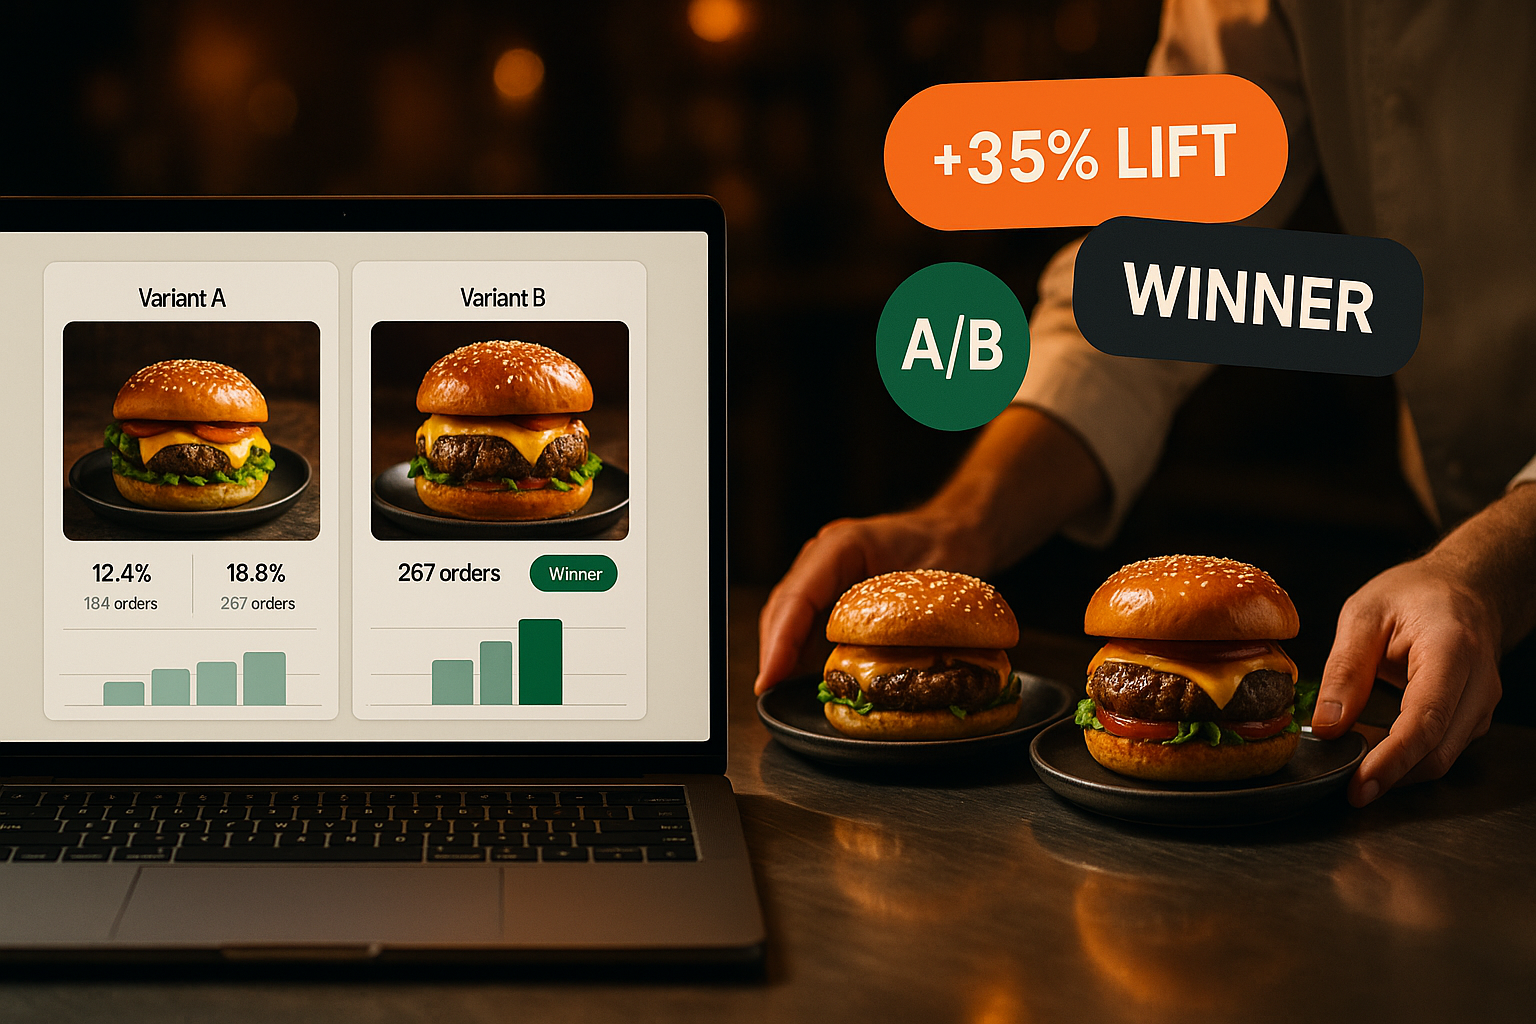
What Is Menu A/B Testing?
You have a product photo you think looks better. A description you rewrote last week. A price you want to try. But you don't know if any of these will actually sell more. A/B testing lets you run both versions at the same time and measure the difference with real orders.
Half your customers see version A, the other half see version B. The system tracks impressions, add-to-cart clicks, and completed orders for each version. After enough data, you pick the winner and apply it. No opinions, no guessing — just numbers from your actual customers.
Why A/B Testing Matters for Menus
Decisions Based on Orders, Not Opinions
Your chef thinks one photo is better. Your partner disagrees. A/B testing settles it with data. The version that gets more orders wins.
See What Customers Actually Do
Track impressions, add-to-cart rate, and conversion to completed orders. Know exactly where each version wins or loses.
Measure Real Revenue Impact
A description change that increases add-to-cart by 15% across 500 views per week adds up. You see the revenue difference in the dashboard.
Continuous Menu Improvement
Run one test, pick the winner, start another. Each round makes your menu slightly better. Small gains compound over weeks and months.
How It Works
Create a Test
Pick a product. Choose what to test — photo, description, or price. Enter version A and version B. Set how long the test should run.
Customers Get Split Automatically
A cookie assigns each customer to group A or group B. They see the same version every time they visit, so results stay consistent.
Track Results in Real Time
The dashboard shows impressions, add-to-cart count, and orders for each version. Updated as orders come in.
Declare a Winner
When you have enough data, pick the winning version. It becomes the live version for all customers. The test ends.
A/B Testing Features
Cookie-Based 50/50 Split
Each visitor is assigned to group A or B via a browser cookie. The assignment is sticky — the same customer always sees the same version.
- 50/50 split by default
- Sticky assignment — consistent experience per customer
- Works across sessions (cookie persists)
- No login required — works for anonymous visitors too
Real Metrics That Matter
Track the metrics that directly affect your revenue. Not vanity numbers — actual ordering behavior.
- Impressions — how many customers saw the product
- Add-to-cart count — how many added it
- Orders — how many actually completed checkout
- Conversion rate per version (add-to-cart / impressions)
Test Multiple Elements
Test anything that could affect a customer's decision to order.
- Product photos — which angle or style sells more
- Descriptions — short vs. detailed, different wording
- Prices — find the price point that maximizes revenue
- Product names — test naming that resonates with customers
Results Dashboard
All running and completed tests in one view. Compare versions side by side with clear numbers.
- Side-by-side comparison of version A vs. B
- Live data — updates as orders come in
- History of completed tests and their outcomes
- One-click winner declaration and rollout
Use Cases
Photo vs. Photo
Your burger shot from above vs. a side angle. Run the test for a week and find out which photo gets more add-to-carts.
Short vs. Long Description
A one-liner vs. a detailed three-sentence description. Some customers want information, others just want to order fast.
Price Sensitivity Check
Would your pasta sell the same at 14.90 as it does at 12.90? Test it on half your audience before committing to a menu-wide price change.
Seasonal Menu Launches
Launching a new dish? Test two names or descriptions before the full rollout. Start with data from day one.
Upsell Copy Testing
Does 'Add a side salad' work better than 'Complete your meal with a fresh salad'? Test the wording that drives more add-ons.
Multi-Location Comparison
Run the same test across two venues. Find out if a photo that works downtown also works at the suburban location.
Why Data-Driven Menus Outperform Static Ones
Most restaurants set their menu once and change it based on gut feeling. A new photo gets uploaded because someone on the team thinks it looks nicer. A description gets rewritten because the owner read a marketing tip somewhere. But nobody measures whether the change actually increased orders. A/B testing closes that gap. Every change becomes a measurable experiment.
Small Changes, Measurable Results
A product description change sounds minor. But when 200 customers see it every day, even a small improvement in add-to-cart rate adds up. If version B gets added to cart 10% more often than version A, that difference compounds across your entire menu and customer base. A/B testing makes these small wins visible and repeatable.
How Cookie-Based Splitting Works
When a customer visits your menu for the first time, a cookie assigns them to group A or group B. Every subsequent visit, they see the same version. This eliminates noise — a customer doesn't flip between versions, which would distort the results. The cookie persists across sessions, so even returning customers stay in their assigned group until the test ends.
From Test to Standard
When a test collects enough data and one version clearly wins, you declare it the winner with one click. The winning version becomes the live version for all customers. The losing version is archived. You can then start a new test on the same product or move to the next one. Over time, every item on your menu has been tested and optimized based on real customer behavior.
Test Your Menu. Trust the Data.
Run your first A/B test today. See which version your customers prefer.
Related features
Other tools restaurants use alongside this one.
Type a business question in plain English, Bulgarian, or Greek. Get a charted, numerically-correct answer in seconds — backed by your live bills and orders, not a guess.
Learn moreUpload a photo, PDF, or Word document of your existing menu. Claude reads every category, item, price, and allergen — you review the result and commit a complete menu in one click.
Learn moreDescribe your restaurant in one sentence. Claude fills in your hero, about, SEO, and FAQ in every language you support — applied to your existing per-venue website. No templates. No drag-drop builder. No designer needed.
Learn moreAn AI agent answers every call 24/7 in English, Bulgarian, and Greek — takes orders, confirms totals, sends a payment link by SMS. No more missed calls during the rush.
Learn more